Every year the U.S. Energy Information Administration releases an Annual Energy Outlook, which presents an objective examination of energy trends and serves as a starting point for the media and policy community’s analyses of U.S. energy regulations.
The American Petroleum Institute (API) has developed an interactive tool that combs through the data from 2014 and 2015 reports and lets users select hypothetical energy scenarios and visualize their effects in easy-to-interpret charts and graphs — sort of a “Choose Your Own Adventure” for energy policy.
What would happen if current laws and regulations governing the energy sector remain unchanged and the economy continued to grow at a predictable rate? These charts, generated using API’s interactive tool, answer that question. If the government energy policies in place remain unchanged through 2040, EIA predicts the U.S. is likely to see increased use of renewable fuels, reduced energy-related carbon emissions and lower energy prices.
Crude oil and natural gas exports rise

This chart, created using API’s interactive tool, illustrates how exports of crude oil and natural gas will increase under this scenario. According to EIA projections, through 2020, strong growth in domestic crude oil production from tight formations leads to a decline in net petroleum imports and growth in net petroleum product exports. This increase in exports helps bolster U.S. energy security by protecting American access to energy resources from volatility in unstable regions.
GDP doubles, due in part to the energy landscape

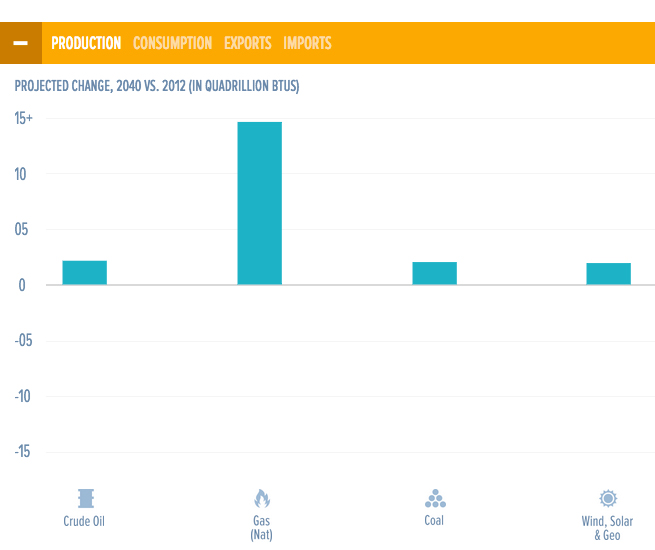
Experimenting with the tool produced this next chart which illustrates how, under this scenario, the U.S. will see increased production of renewable energy sources like wind, solar and geothermal energy through 2040. The graph also shows that though production of coal will go up, the increase is small compared to the increase in production of natural gas (a low-carbon energy source). EIA projects that from 2025-2040, natural gas will fuel more than 60 percent of new electricity generation and renewables will supply the rest.
GDP doubles, due in part to the energy landscape

This chart illustrates how real GDP is projected to more than double between 2012 and 2040. This growth will largely be caused by projected increases in overall national employment, aggregate demand and other factors that contribute to general GDP computation. However, the energy sector is projected to be a significant contributor to this growth — an increase in U.S. net exports of energy will help drive the overall GDP increase.
Compare and contrast: “no sunset” on tax credits results in fewer CO2 emissions

This chart is an example of how, with API’s data tool, users are able to cross-reference numerous hypothetical energy scenarios. The chart above is the result of crossing the “no sunset” scenario with the “reference case” scenario outlined in the preceding charts. The “no sunset” scenario represents what would happen if current tax credits on renewable energy resource development were extended. This chart shows that eliminating the sunset provisions on tax credits for renewable energy resources would lead to a smaller increase in CO2 emissions by 2040 than if those credits were allowed to expire. This is because the tax credits enable development of renewable energy sources, which emit less carbon dioxide.
You can dig into the EIA data yourself using the tool below.
How does the tool work? Click on the check box in the lower right of one or more of the subject boxes below to choose a hypothetical scenario. Then click the “Visualize” button to see what happens.


